
Why INSCYD Analysis over Traditional Lactate Testing?.
Traditional testing is one dimensional and does not provide a complete picture of an athlete’s metabolic performance. Utilizing the latest in spots science, the INSCYD software allows us to determine exactly how an athlete’s body generates energy, which means that your training is even more individualized.

YOUR QUESTIONS - OUR ANSWERS
Are you a long course triathlete or endurance cyclist/runner with a low VO2Max that limits your speed?
Is your body’s ability to metabolize its fat stores limiting your performance during long workouts or races?
Are you more suited to more intense, shorter races due to a high anaerobic capacity (VLamax)? Our software, combined with our knowledge and analysis, will provide these answers…and much more.

TRADITIONAL LACTATE TESTING
In traditional lactate testing, a stepped test in completed with lactate samples being drawn at predetermined time increments. The increase in exercise intensity elicits a response from the working muscles, which produce more lactate. By accurately measuring the lactate levels at each intensity we can plot the buildup of lactate in the blood stream and determine ideal heart rate and/or power training zones. This does allow for tracking improvements from one test to the next, but this is where the traditional lactate testing is limited…
The Solution: INSCYD complete metabolic performance testing
What INSCYD does is takes standard lactate testing many steps further. Utilizing either a series of Critical Power Tests, Lactate Sampling or a combination of the two, not only can ideal training zones be developed via the software, but we can also determine the athlete’s VO2 Max (Aerobic Capacity), VLa Max (Anaerobic Capacity), Anaerobic Threshold (Maximal Steady State Power (FTP)/Pace), FatMax (Maximal Fat Combustion) & CarbMax. Simply put, our software allows for a complete metabolic profile of the athlete which will instantly allow us to determine each individual’s strengths and weaknesses AND exactly how to address those to maximize performance gains.

VO2max
With the INSCYD Testing results we get an accurate indication of your muscle’s ability to uptake and utilize oxygen to generate energy. VO2max is highly trainable and is one of the most important factors in determining an athlete’s endurance potential. The graph to the right shows energy demand in ml/min/kg (Dark Blue Line) and the athlete’s ability to provide energy from the aerobic metabolism (Royal Blue Line), also in ml/min/kg. As power output (x-axis) increases the two curves deviate and begin to widen considerably at high wattages. The shaded area above the line indicating the athlete’s aerobic capacity represents the anaerobic component to that power output. The longer the Royal Blue curve hugs the Dark Blue demand line the more aerobically fit the athlete.

Lactate:
Production, Concentration & Maximal Oxidation
Your results also show us your lactate production rate in mmol/l/min (Red Curve) at various power outputs (x-axis), along with your aerobic energy system’s ability to combust that lactate (Blue Curve). The point at which the two curves cross is your Maximal Lactate Steady State or Anaerobic Threshold (Functional Threshold Power). The Yellow Curve represents the concentration of lactate in the blood at a steady state across multiple power outputs. This information is highly useful in determining pacing strategies for events and training.
.
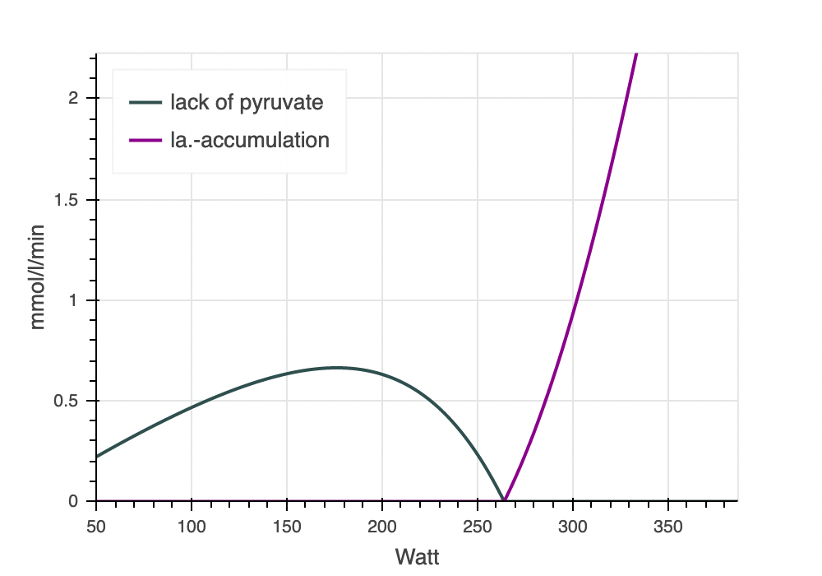
Lack of Pyruvate & Lactate Accumulation
An important graph for knowing an athletes lactate accumulation and combustion rates is key to designing effective training sessions and allows the athlete to see how long a particular effort will take to clear within the aerobic metabolism. The Gray Curve is referred to as Lack of Pyruvate in the aerobic energy system and is the amount of lactate in mmol/l/min that can be cleared in addition to the gross production at a particular power output (x-axis). The Purple Curve is the amount of lactate accumulation in the blood at intensities ABOVE anaerobic threshold. This graph gives us the ability to know how much lactate is accumulating at a particular intensity AND how long that effort will take to recover from.

Fat & Carbohydrate Combustion
Arguably the most important graph provided from the INSCYD test is knowing an athlete’s ability to utilize fat stores as fuel and how much carbohydrate is required to meet the total energy demand for a steady state power output. The Green Curve is the fat combustion capability at various wattages (x-axis). The peak of this curve is considered FatMax with the Green shaded area being the “FatMax Zone”. The Red Curve is the athlete’s carbohydrate combustion at various power outputs with the Orange shaded area being the maximal exogenous carbohydrate intake of 60-90g per hour. An intake of 90g/hr is referred to in the most current sports science literature as the absolute maximal the body can absorb and is termed “CarbMax”. Lastly, it is important to note that the Green fat combustion curve terminates to zero at anaerobic threshold. From this intensity and higher fat is pushed out of the metabolism and carbohydrate are utilized almost exclusively.